
Welcome to R Workshop Series
Last updated 10/31/2017
This site was set up to host the content taught during these sessions and are meant for students for reference or for self-study. It is split into different sessions:
- Installation & Orientation
- Basics through DataCamp
- Importing data
- Data cleansing (coming soon)
- Visualization (coming soon)
- Regression (coming soon)
Stay tuned as we add additional sections!
Overview
Why use R?
R is a free, open-source, text-based programming language originally designed for data analysis. Since its introduction, lots of people have added additional software packages to it that expanded its functionality. It can create sexy visualizations, build websites like this one, do advanced machine learning, and more!
Another important question for business school students is which language should I choose to learn? R? Python? etc. At this juncture, it doesn’t really matter which you learn. What’s more important is that you take away the principles and concepts of how these text-based languages work. Once you learn one, you can learn the other very easily. The difference is syntax.
Lastly, text-based languages are transparent, reproducible, and are editable workflows. It’s generally easier to follow a code flow than an Excel or Access file.
Installation and Orientation
Installation
You will need to download and setup two things to use R.
For the R link, click your OS and click the first link. You’ll want to download the main or newest version. For RStudio, you’ll want to look under the installers section and click the link for your OS.
Why do you need two? R is the software that allows your computer to run and read R code. RStudio is another software package that makes R a lot more user-friendly. It has a graphical interface and a bunch of nice features to make code writing easier.
Orientation
When you first open RStudio, you should see 4 windows:
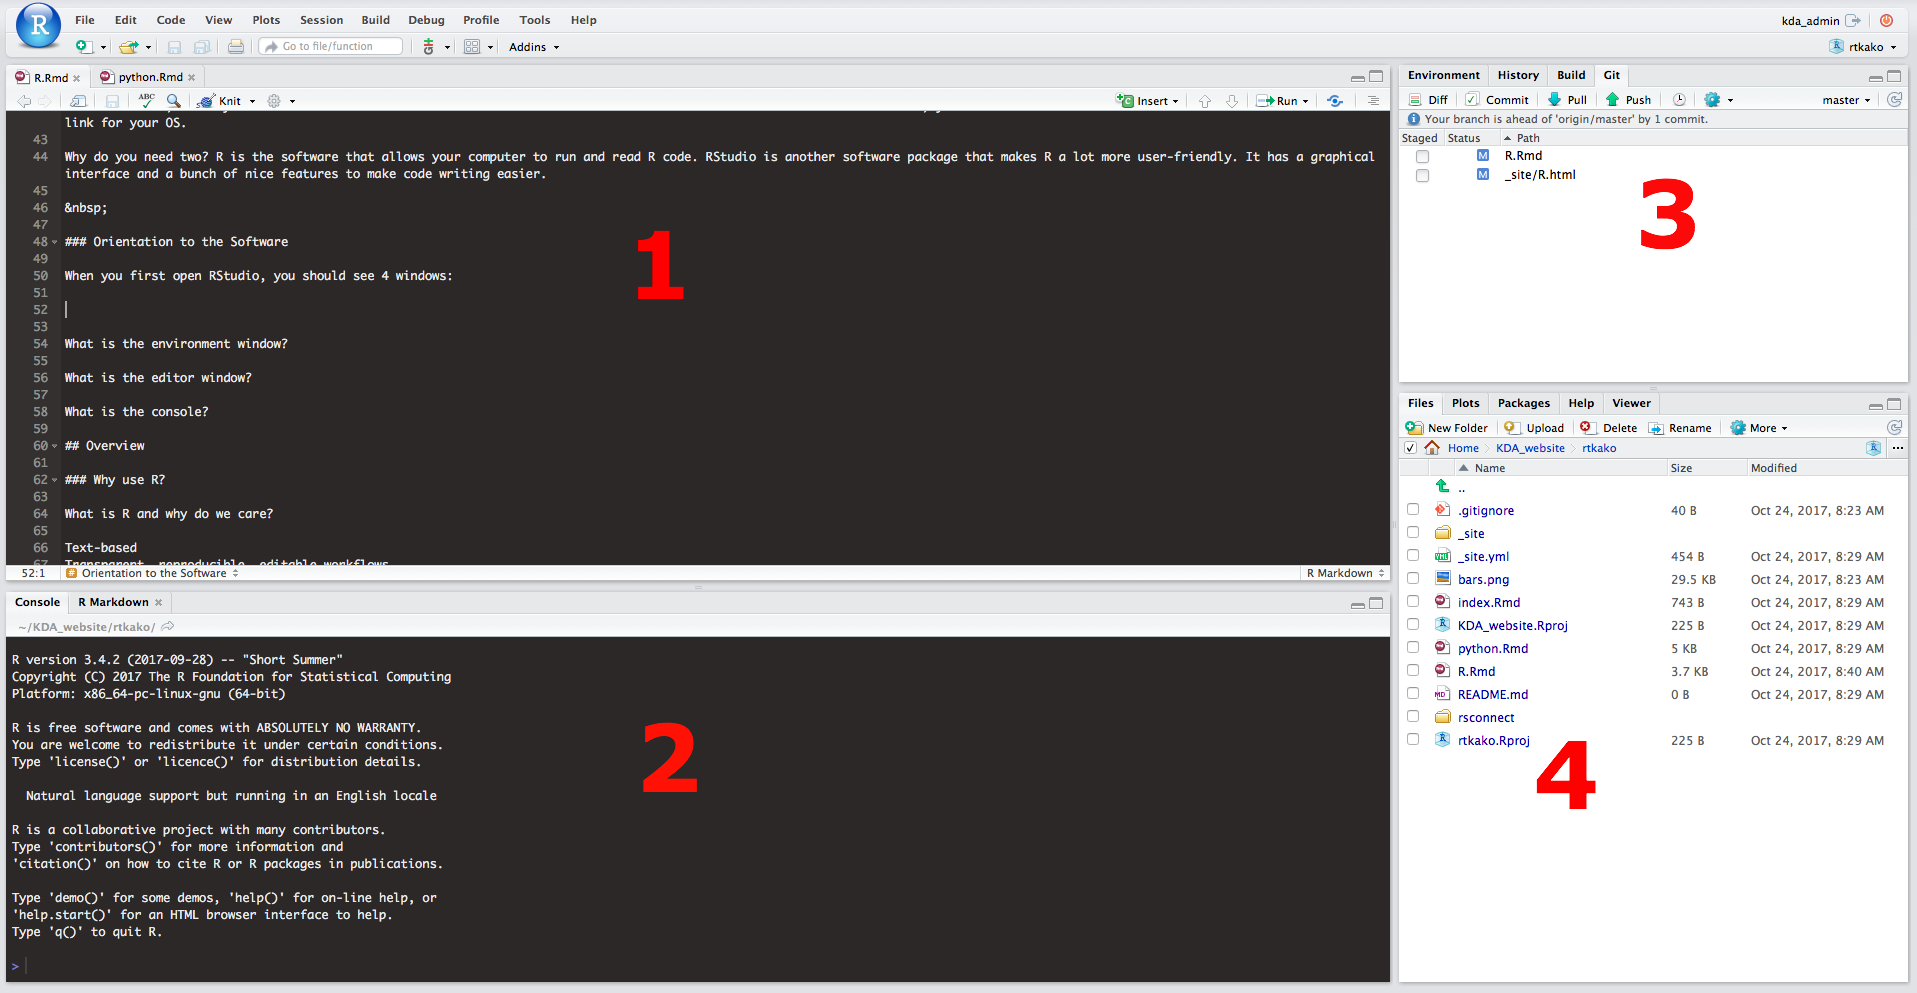
- Code editor: this is where you’ll be typing your code
- Console: this is like your DOS/terminal which will show you code results. You will RARELY be typing into this window.
- Environment: this shows you what types of variables and libraries (software addins) that you have in your session
- File Window: this shows you the directory of files.
The entire interface is customizable, so don’t worry if you don’t see this exact setup or if you don’t like it. The most important screens we will be dealing with are the code editor and the console!
Basics through DataCamp
We highly recommend going through the DataCamp course: Introduction to R for Data Science to learn the basics of programming and R. You can find a link to it under the Resources tab up above. It’s super intuitive, does a good job teaching the basics, and gives you a follow along environment in your browser that’s really helpful.
In it, you’ll go over a lot of programming basics that you’ll have to know to use more advanced functions in R:
- operators: how math functions work
- variables: how to assign stuff
- data types: what types of data can you store in variables
- vectors: how to store MULTIPLE data points
Importing Data
Now that you know the basics, let’s get started!
There are two ways to import data. You can either load data in from your computer OR you can download it from the internet.
Loading data from your computer
Let’s try using a sample dataset. Y’all remember autoparts from DECS-431?! You can download this file here @ xxxxxxx.
Follow along by typing this into your editor window. You can then run the code by clicking the “Run” button in the Editor window and seeing the results in the Console window.
df = read.csv(file = "~/KDA_website/data/autoparts.csv")
# We chose a variable called df but you can really choose anything (df is standard for dataframe).
# The filename and path for you will be different based on where you save your autoparts file.

head(df)
## X sales pop3mi inc3mi
## 1 0 3104 81091 45834
## 2 1 1664 182381 35875
## 3 2 4312 116345 56149
## 4 3 3807 135325 48502
## 5 4 3187 111246 61989
## 6 5 3877 118329 58673# Head is a function to show the top 6 lines from this dataset.
# df is the variable name we chose for the autoparts dataset. Checking your data is ALWAYS best practice. You want to make sure you are looking at the right file and that you aren’t missing data or seeing data that you don’t expect. You can also check your data by going into the Environment window and clicking on the df variable that is created when you load the data.
You may have noticed that there were lines prefaced by the # sign. These are called comments, and are lines that are NOT run and are used for documentation purposes. Best practice is to use these AS much as you can. You are aiming for legibility.